Commerce
Storefront, catalog, checkout and orders.
Parts
19in the order they sit on the screenThe round calendar button after the four ranges, for any dates. It opens a list of ranges, each with the dates it means, then a two month calendar and Apply. Reports count in days of the report time zone, never the browser's midnight. The four quarters of this year and last are listed too. A range longer than the report limit is refused.
- Today
- Yesterday
- Last 7 days
- Last 30 days
- Last 90 days
- Last week
- Last month
- Last quarter
- Month to date
- Quarter to date
- Year to date
- Last 12 months
- Black Friday Cyber Monday
- Custom
- Two months of calendar to pick the days.
Shows when: The report reads a range you choose. On a narrow page it moves into the ... menu, after the comparison.
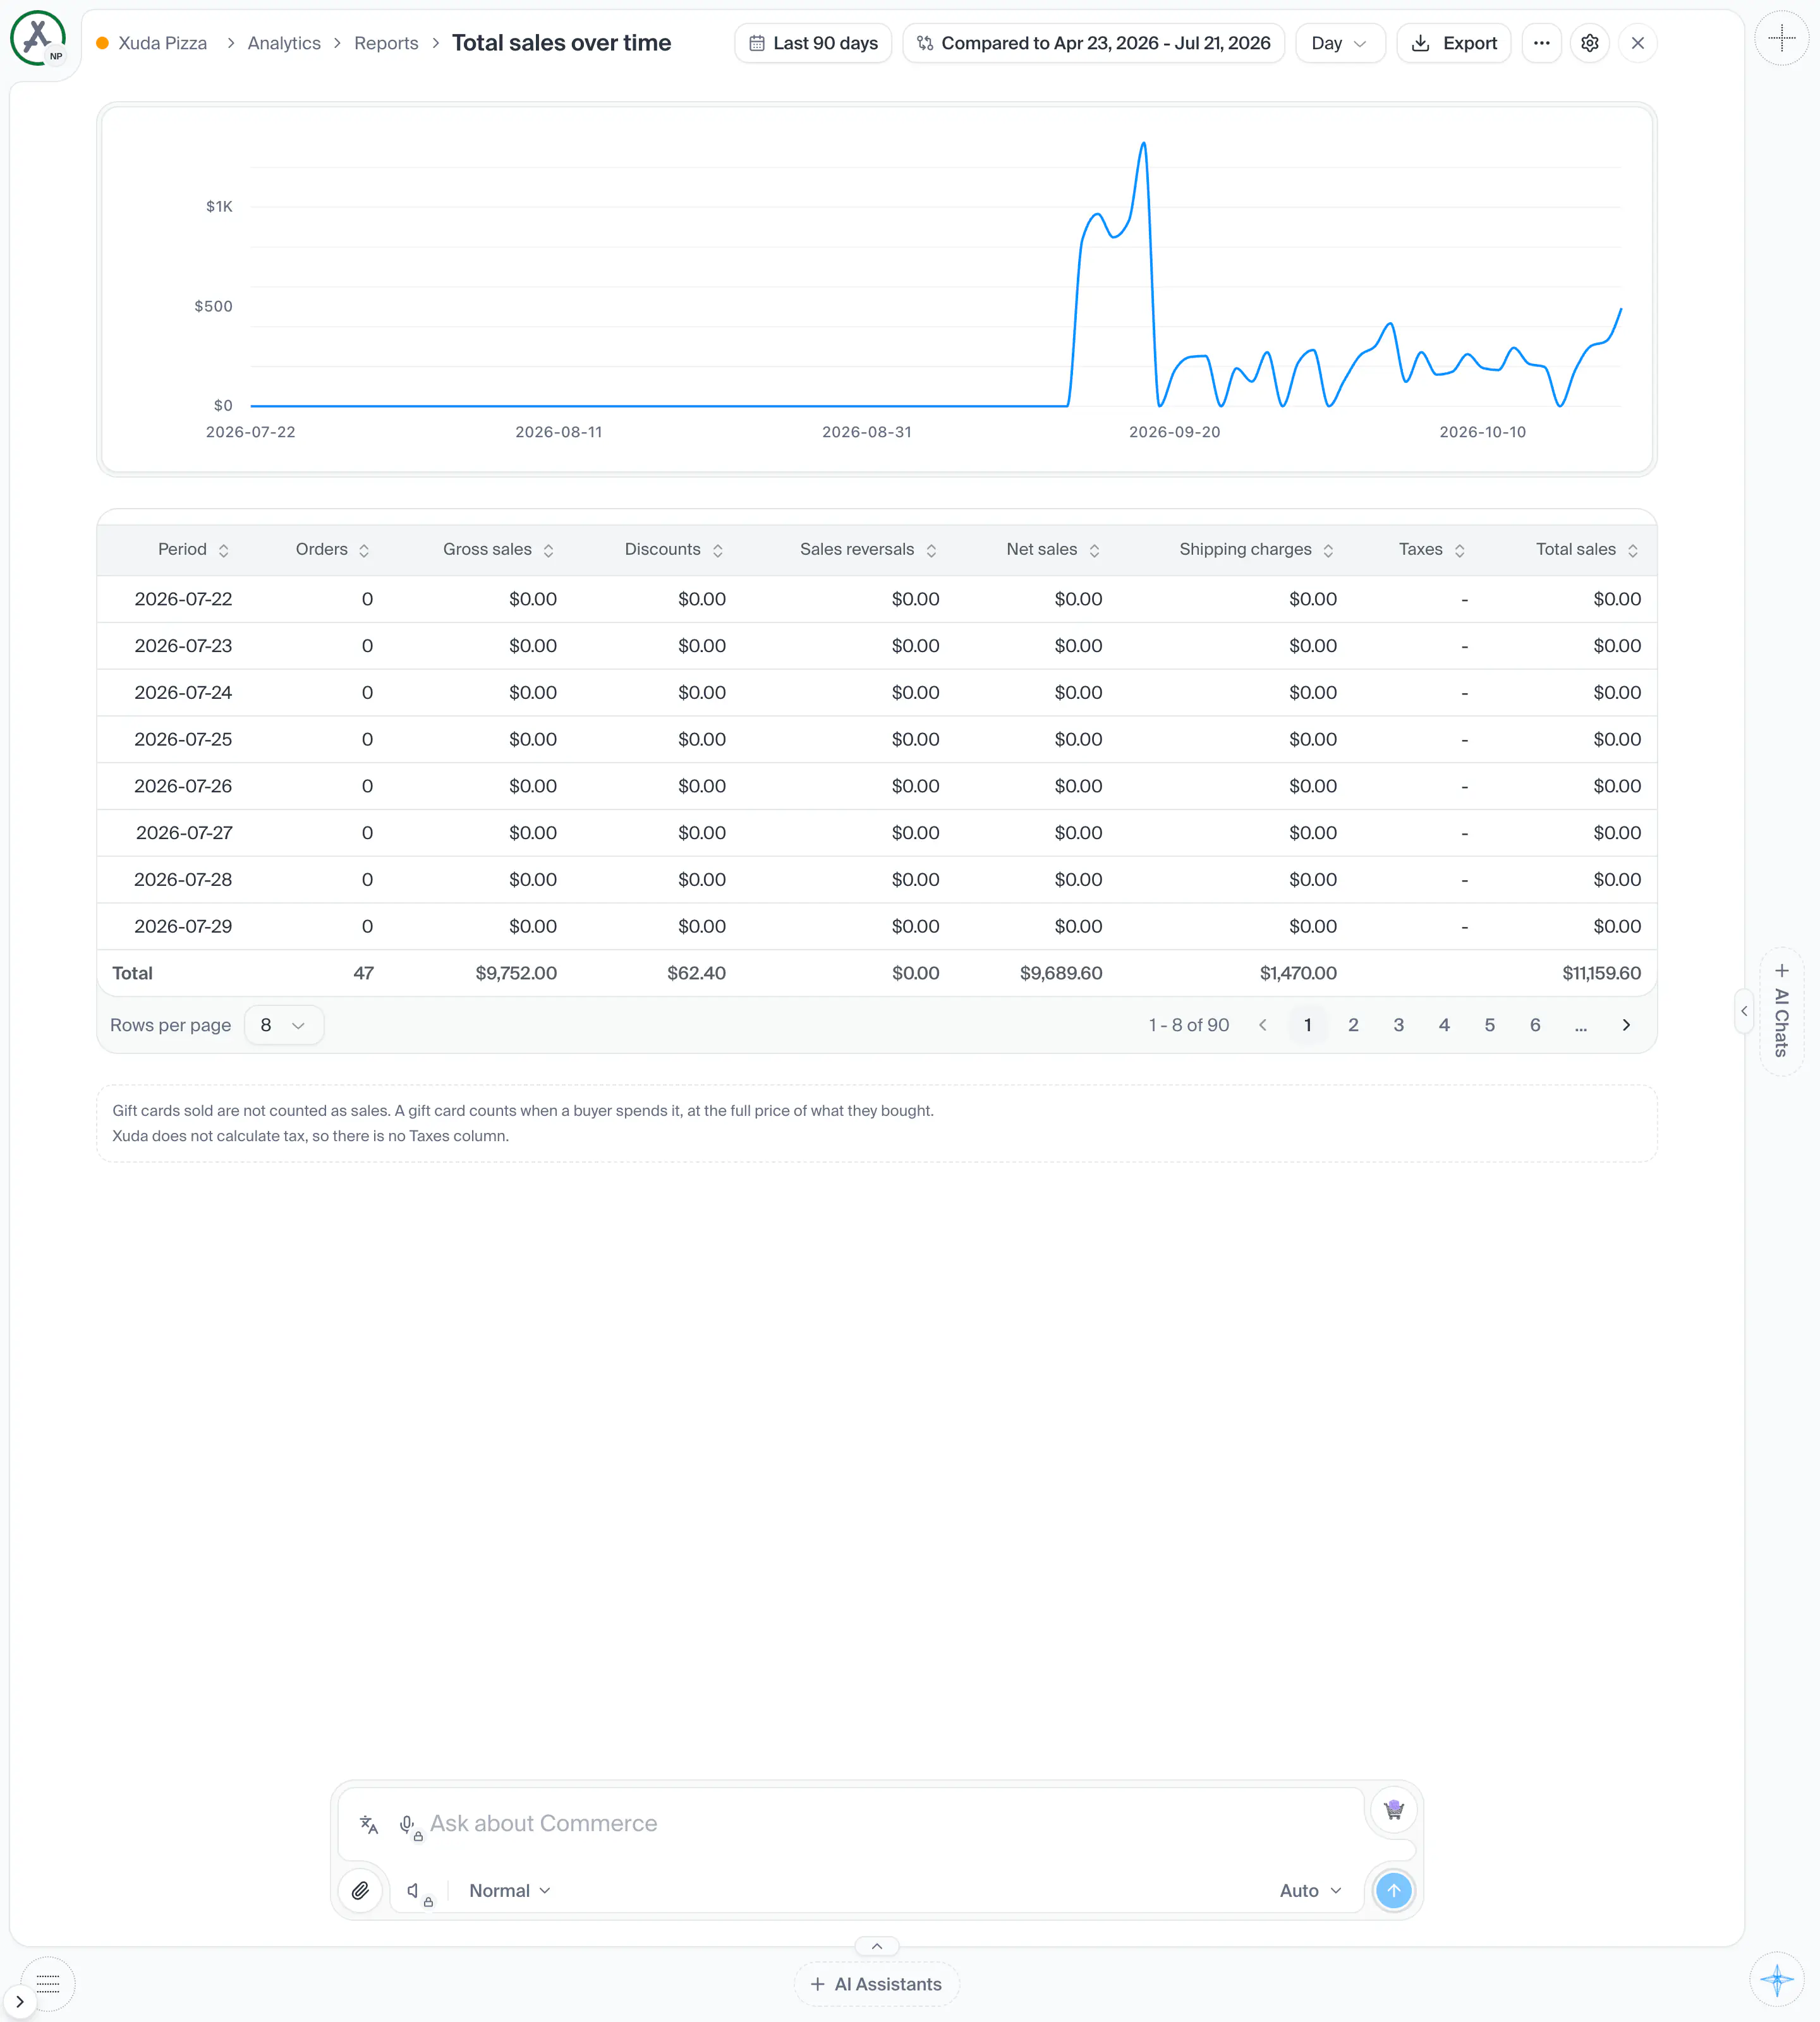
Shot from the dashboard on November 20, 2026. The business and its customers are made up.
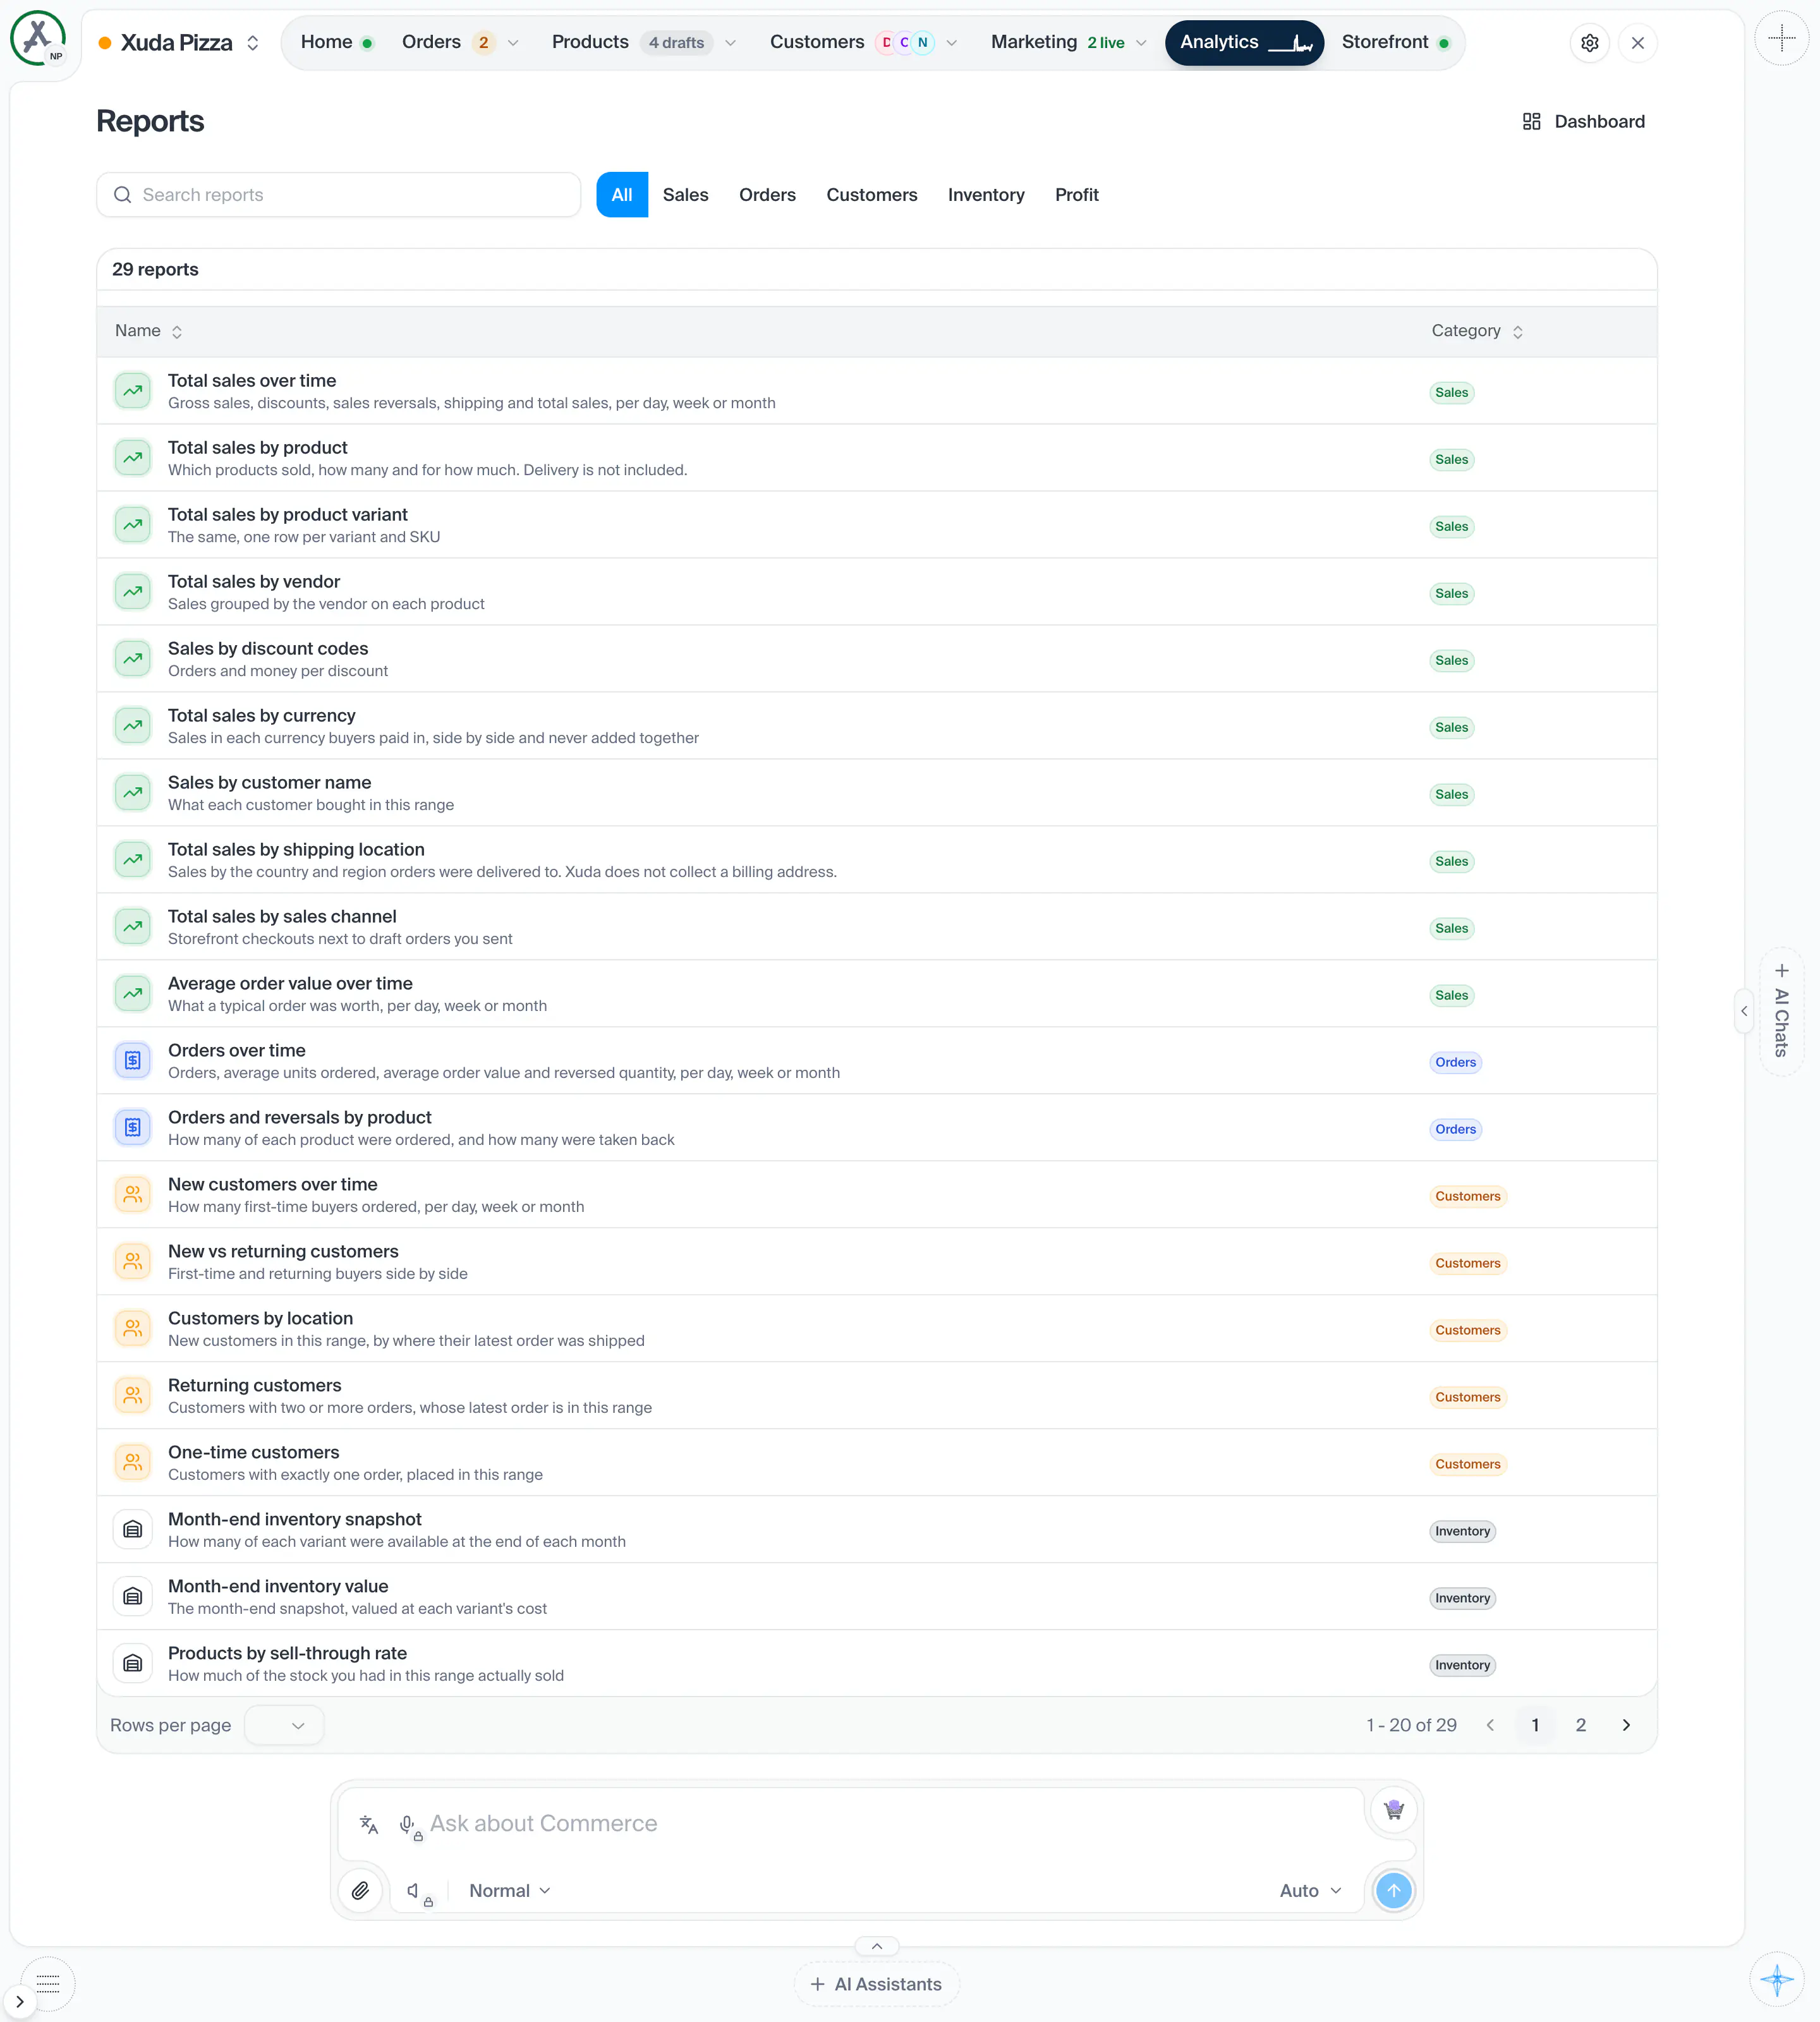
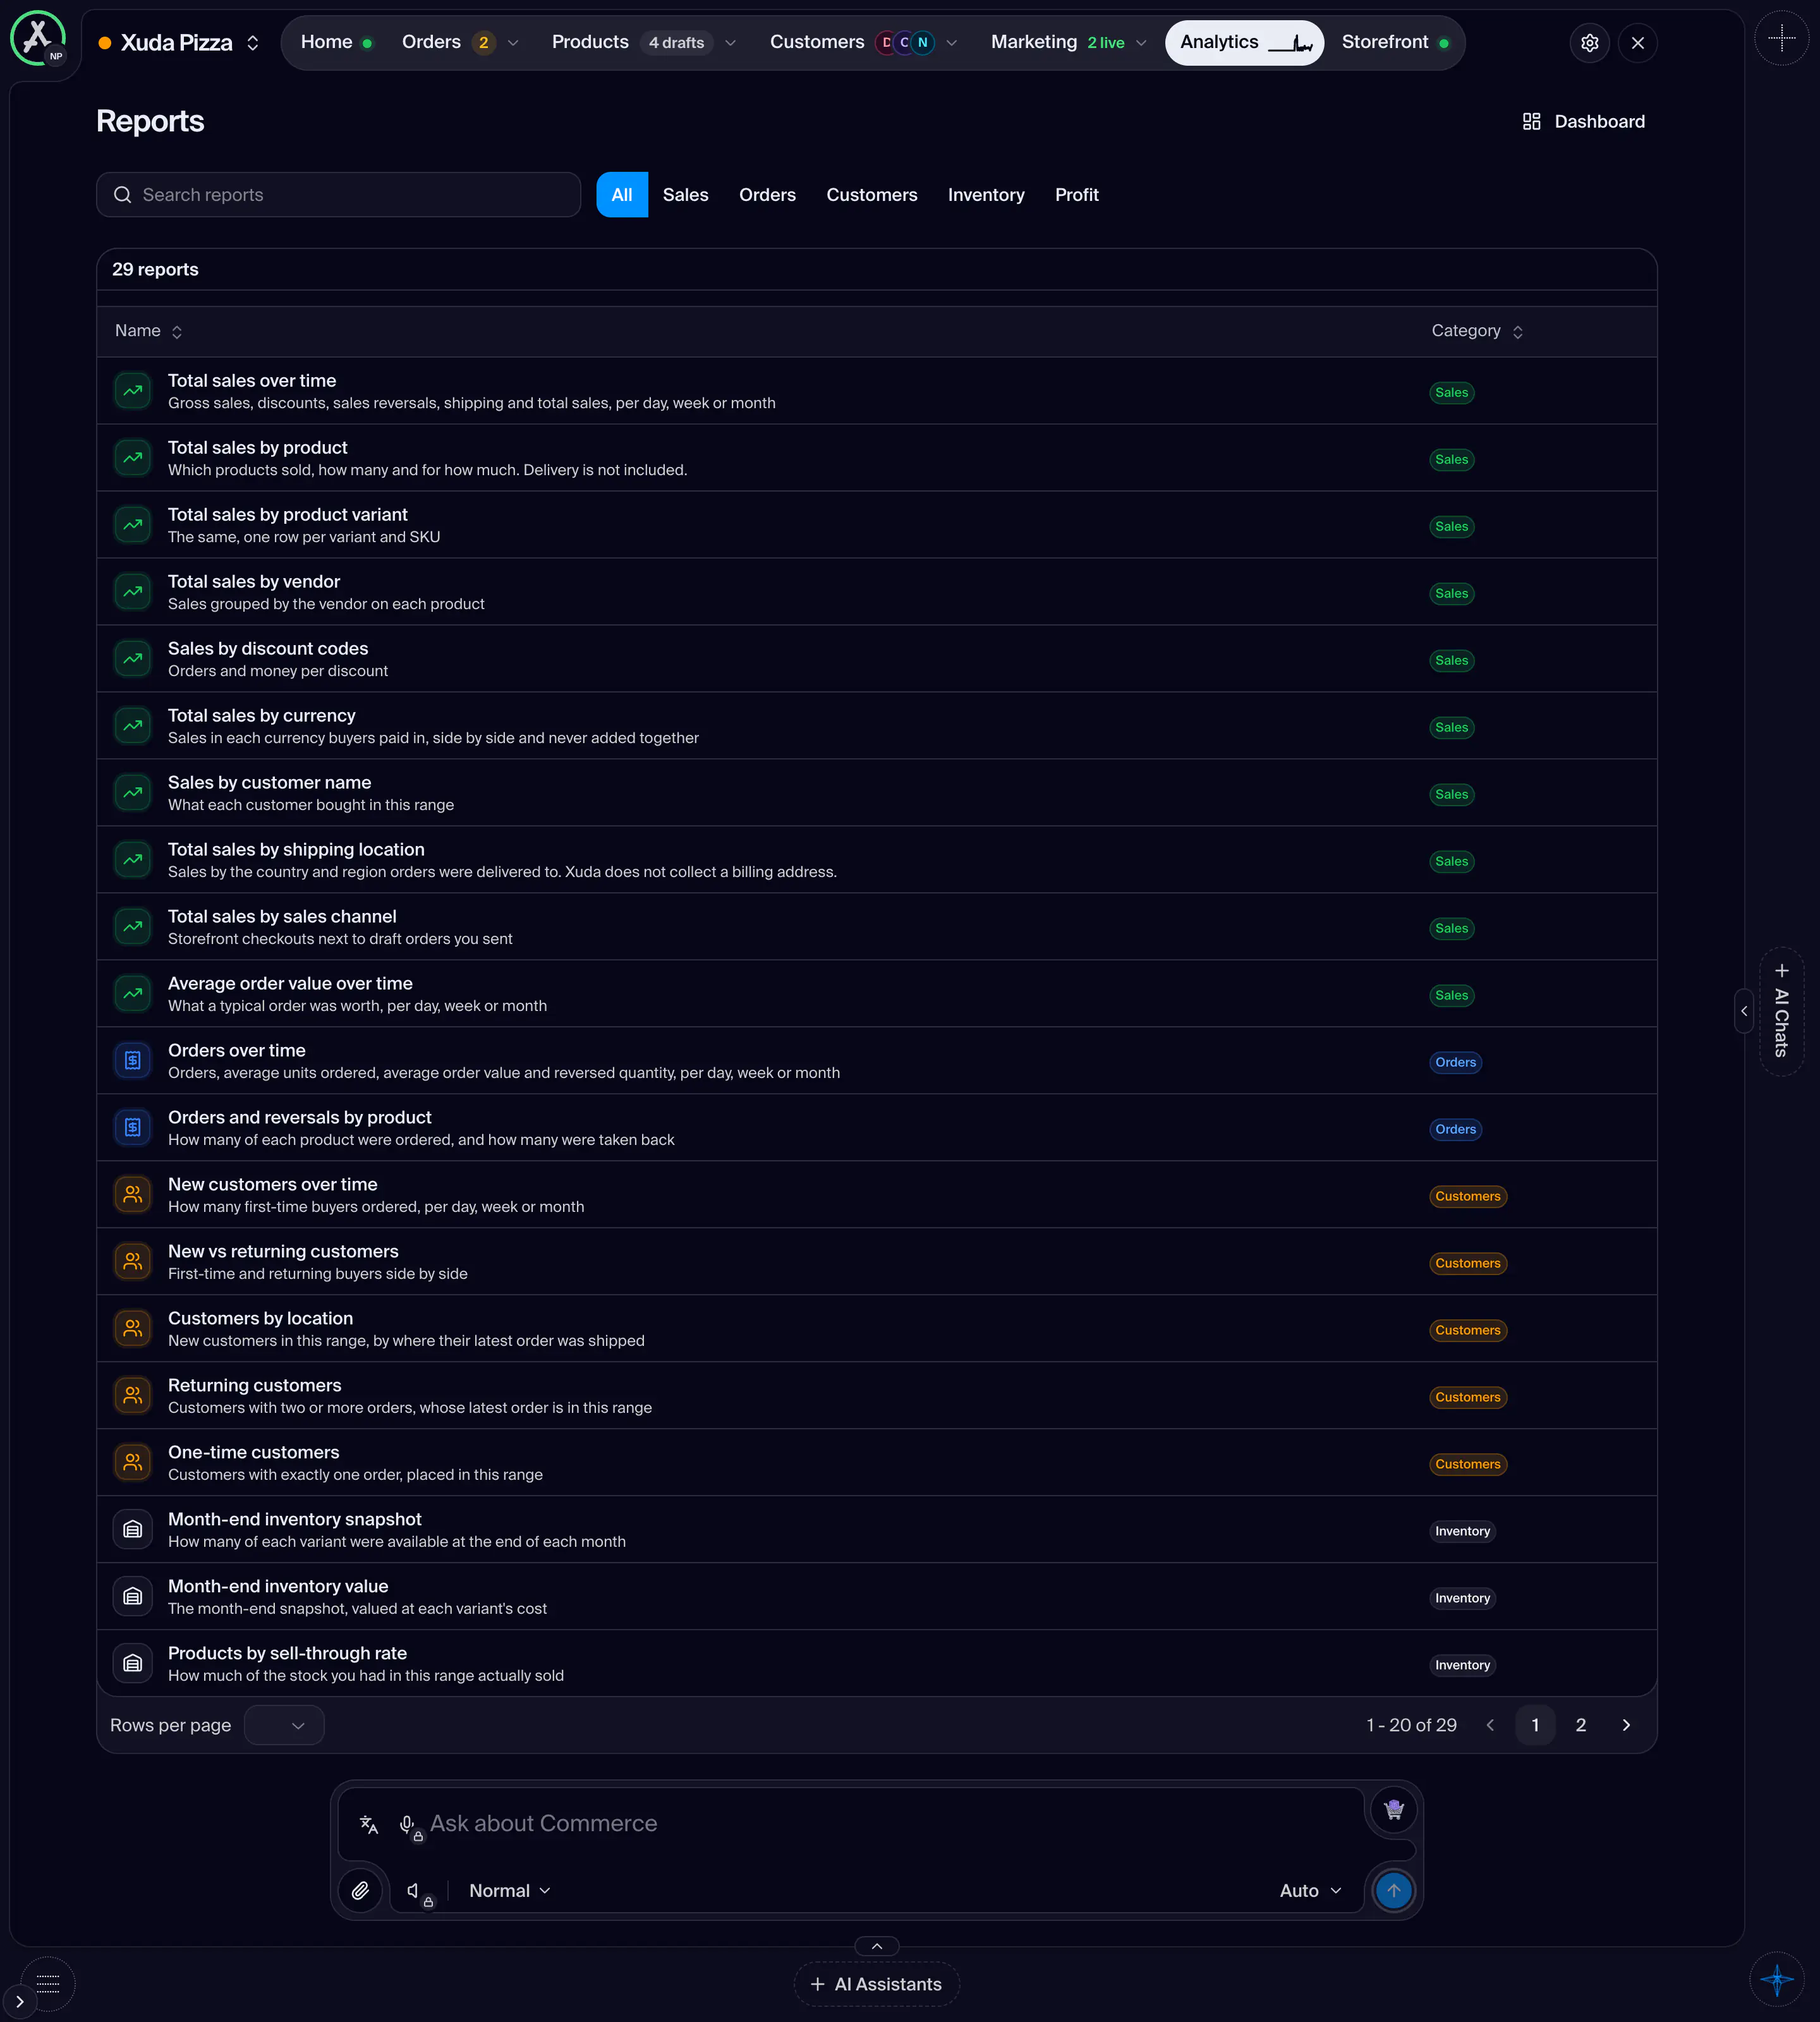
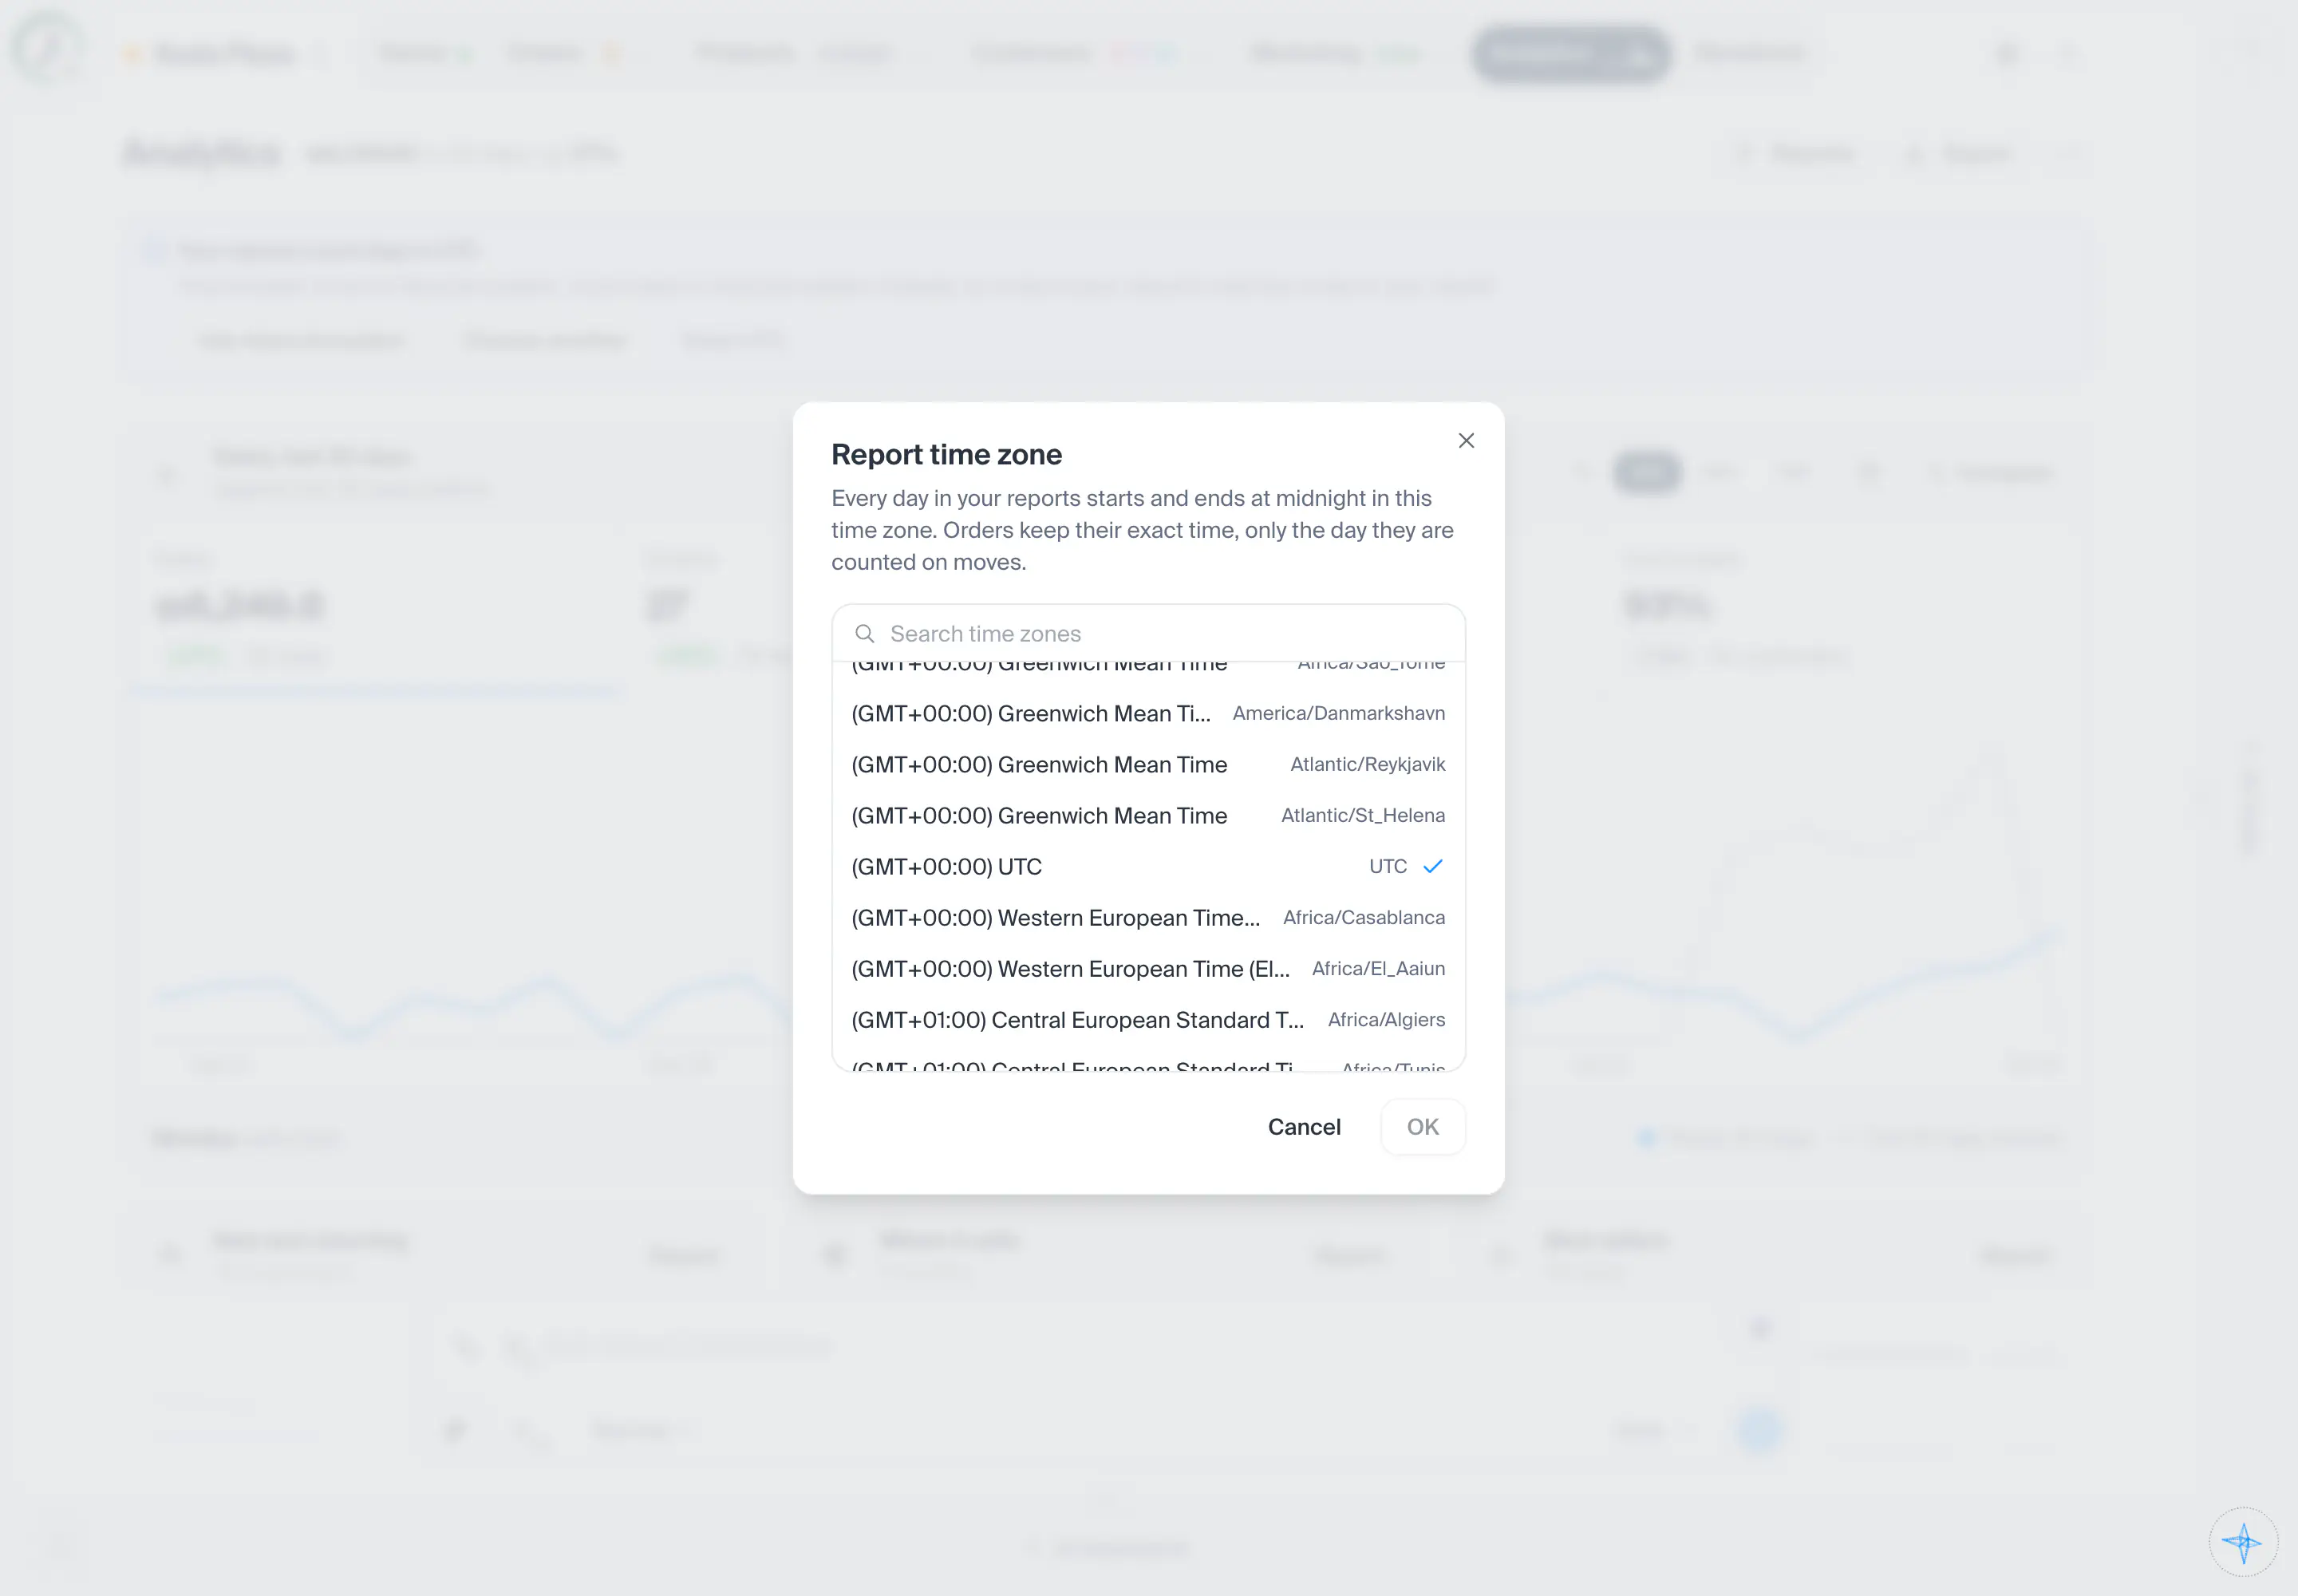
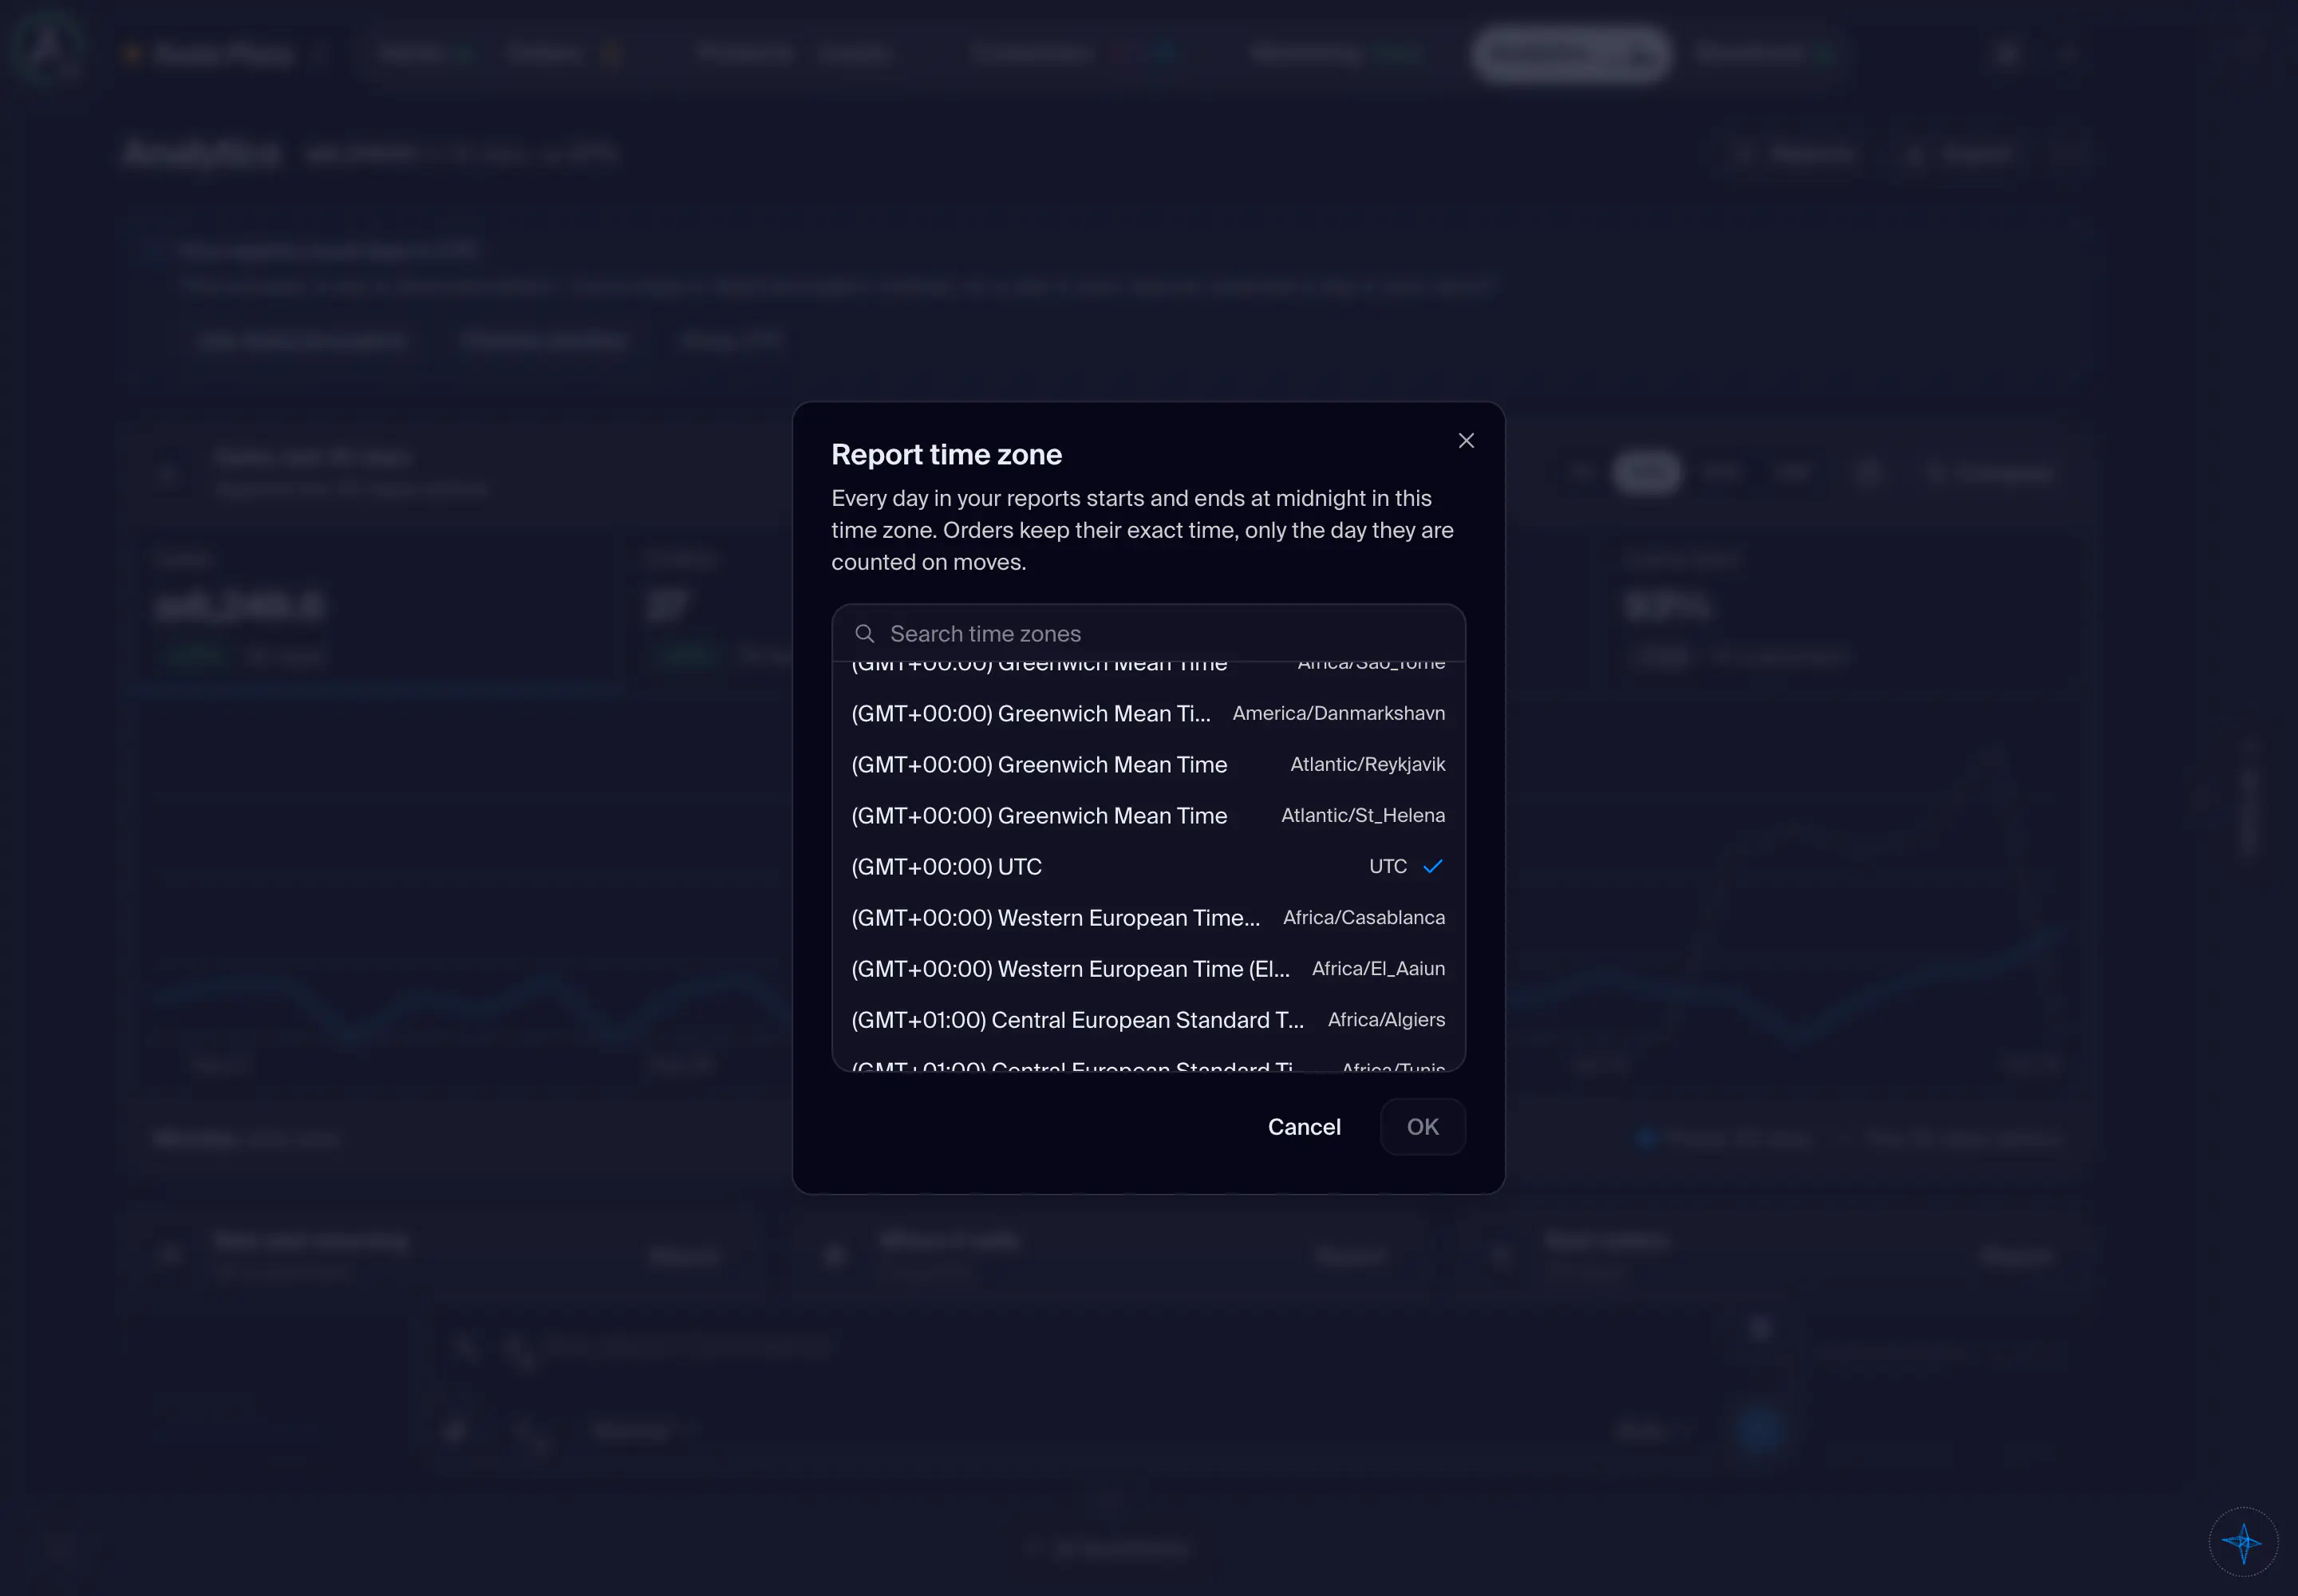
One report of the store, every one through this same page. Opened from a tile on the Analytics board it reads the board's range, comparison and currency, and its head grows out of that tile; opened from the Reports library it reads the range the store last read. One row of acts sets the range (7D, 30D, 90D or 12M, or Pick dates for any dates) and whether it is set against the period before; the ... menu holds Group by, the currency, Export as CSV, Recalculate, All reports and Change time zone. The head names the report with the range at its end, then the figure with its count, one plain sentence about the range, a key and a dot drawing. Under it the breakdown lists only the periods that had something, folds a run of empty ones into one line and ends with a totals row; columns the range never used are dropped and named once in its foot. The trail is Store, Analytics, then the report when it came from a tile, or Store, Analytics, Reports, then the report when it came from the library, and Close goes back to the board or the library it came from.
- How you get here
/dashboard/commerce/:store_id/analytics/reports/:report- Opens on
- One store of yours
What opens from here